Managing filters
Before proceeding any analysis with piXedfit, we should make sure that our photometric filters (i.e., the transmission curves) are recognized by piXedfit. For this, piXedfit provides functions for managing the library of filters within the piXedfit system. Below, we will demonstrate how to manage the filters library. For more information about the functions, please look at the API reference here.
See available filters
To see a list of filters that already available in piXedfit, we can use list_filters() function.
from piXedfit.utils.filtering import list_filters

filters = list_filters()
Add filter
We can also add a new filter transmission using add_filter() function.
from piXedfit.utils.filtering import add_filter

filter_name = 'name_of_filter'
filter_wave = fil_w                     # wavelength grid in the transmission function
filter_transmission = fil_t             # transmission function
filter_cwave = c_wave                   # central wavelength of the filter
add_filter(filter_name, filter_wave, filter_transmission, filter_cwave)
Remove filter
To remove a particular filter from the library in piXedfit, we can use remove_filter() function.
from piXedfit.utils.filtering import remove_filter

remove_filter(filter_name)
Change filter name
One can change name of a filter in the library using change_filter_name() function.
from piXedfit.utils.filtering import change_filter_name

change_filter_name(old_filter_name, new_filter_name)
Get filter transmission
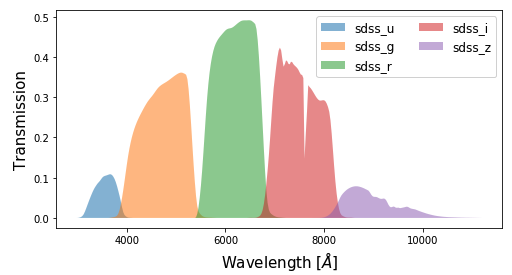
It is also possible to get the transmission curve of a filter. The following is an example of script to retrieve and plot the transmision curves of SDSS filters using the get_filter_curve().
from piXedfit.utils.filtering import get_filter_curve

filters = ['sdss_u', 'sdss_g', 'sdss_r', 'sdss_i', 'sdss_z']

fig1 = plt.figure(figsize=(8,4))
f1 = plt.subplot()
plt.xlabel(r"Wavelength [$\AA$]", fontsize=15)
plt.ylabel("Transmission", fontsize=15)

for bb in range(0,len(filters)):
    fil_w, fil_t = get_filter_curve(filters[bb])

    f1.fill_between(fil_w, 0, fil_t, alpha=0.5, label=filters[bb])

plt.legend(loc=1, ncol=2, fontsize=12)
Get central wavelengths of filters
One can also get the central wavelengths of filters using the cwave_filters() function.
from piXedfit.utils.filtering import cwave_filters

photo_wave = cwave_filters(filters)
filters is a list of filter names.